The job of the investment advisor, in part, is to filter all the daily financial noise down to the most salient, most valuable predictive data. After all, we are entrusted by our clients to invest with the future in mind, not the past. This is easier said than done. We are bombarded with economic statistics every day. Most are isolated tidbits which require context to give them meaning. Many have no predictive value whatsoever, but are ascribed so by the commentators. The “noise” is almost deafening! Mute the TVs!! Earmuffs!!! Okay, let’s try to remain calm. One stat given some attention each month comes from The University of Michigan’s Consumer Survey Center. They question 500 households each month regarding their financial conditions and attitudes about the economy and compile with the answers a series of Indexes. The “Expectations” Index represents only a small part of the entire survey. It focuses on three areas: how consumers view prospects for their own financial situation, how they view prospects for the general economy over the near term, and their view of prospects for the economy over the long term. Even though the general public has a bad reputation for predicting financial outcomes, I thought I’d take a peek behind the curtain. If nothing else, we will see some interesting information.
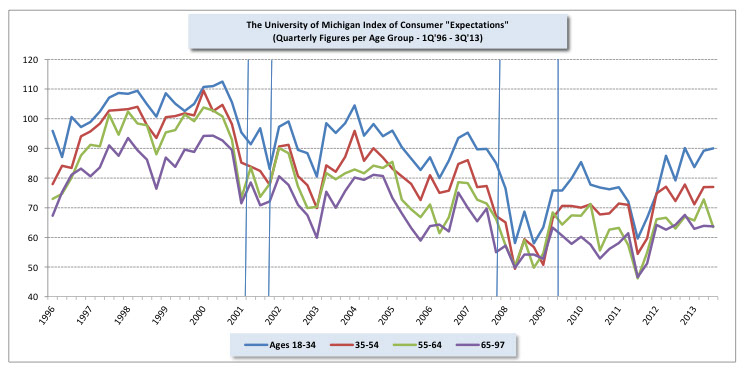
The first graph illustrates the “Expectations” Index since 1996. Each line represents a different age group (as noted in the legend). The vertical lines represent the starting and ending points of the last two recessions (Source: NBER).
Takeaways
- Since about 1998 our short and long run economic expectations have gravitated lower overall.
- The most recent data indicates horizontal drift, no meaningful direction.
- From youngest to oldest, in general, each succeeding age group is consistently less optimistic than the next at each data point (Note: As an aside, in this survey, men are consistently more optimistic than women).
- Sentiment was decreasing leading into both recessions, but it was also doing so in 1998, 2005, and 2011 without a coinciding recession. Most recently, it was the debt ceiling standoff of 2011 which had people feeling blue about their financial future.
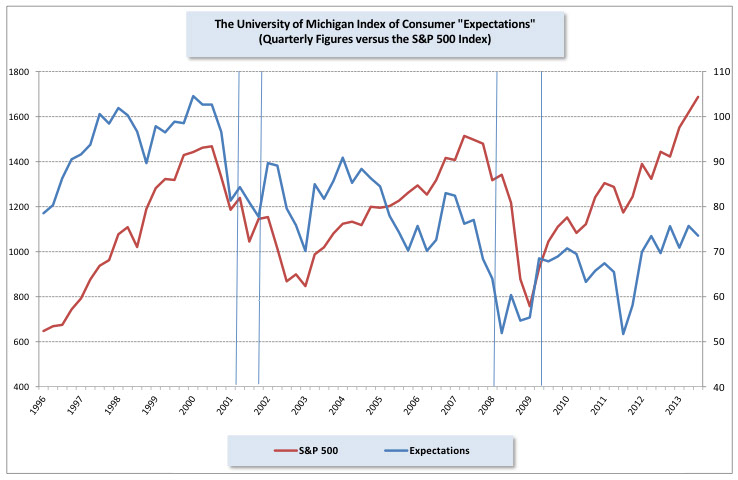
Okay, so the “Expectations” Index is not a reliable indicator of oncoming economic slowdown. So what about the Index’s correlation with stock prices? Economic output and stocks have a poor link, but that doesn’t mean our sentiment Index can’t give us some foresight on stocks. The second graph takes the average Index output and pits it up against the S&P 500 Index price movements over the same time period.
Takeaways
- Segments seem to imply correlation while others don’t. There are big spreads in the mid-90’s and today. In fact, the spread between how we feel about our future prosperity and stock market results is greater than at any time in the last twenty years (and probably much longer, but the data set is limited).
- In terms of short-term predictive value, the “Expectations” Index falls short of telling us where stocks are headed. The quarterly change in the Index has a correlation of only 43.2 (out of 100) with the ensuing quarterly change of stocks. In addition, the correlation of the six-month change in the Index to the ensuing annual change in stocks worsens to 36.5.


