At the Risk of Boring You …
Nominal Gross Domestic Product (GDP) = Monetary Base x Velocity of Money
There is a large, clear cylinder-shaped chamber … you step in. A switch is flipped and the confetti laying on the floor starts to blow. We have all laid witness to the ensuing frenzy. The last for me was at a Chuck E. Cheese during a child’s birthday party. The little guy used the smothering technique to collect quite a haul of game vouchers.
Now let’s assume the papers represent all the dollar bills in the economy (the Monetary Base). Let’s further assume the switch can be set from 1 to 10. At level 1, the bills barely fly above your feet. At 10, it’s a veritable winter squall of money. The speed you choose is (the Velocity of Money). Now assume each time two dollars collide within the chamber an economic “transaction” occurs (e.g. – Little Jimmy buys some Pokémon cards with his allowance). As you would expect, with more Velocity, more transactions take place.
Now take a look at this graph (courtesy of the Fed Reserve Bank of St. Louis):
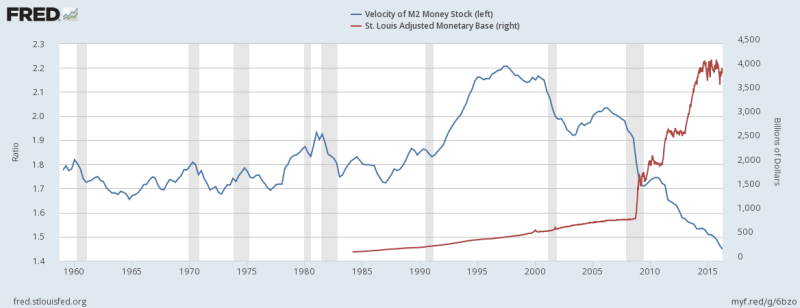
The shaded areas represent recessions, and when they arise, velocity tends to decrease. As you can see, velocity held steady within a reasonable range for some 30 years until the early 90’s. Then, with Wall Street-devised financial innovations and dot.com fever, they spiked (along with GDP) until the bubble burst, ended the party. Velocity picked up again in concert with Fed-sanctioned low rates and the resulting housing bubble, culminating in the financial crisis of 2008. And then what do you see?
After firing all conventional bullets at an economy bloated with debt, Ben Bernanke, like Dr. Frankenstein flipping the switch, decided to electrify the Monetary Base (via QE). His precious theories became reality. The experiment had begun. And velocity was doomed. If you ever read The Phantom Tollbooth, you know of the Doldrums. That is where we are stuck. We haven’t seen this kind of durable, sub-par weakness in a “recovery” period since the Depression (the era, ironically, Bernanke is ‘expert’ on).
And today, despite QE being on hold, the Velocity of Money has continued to decline, and by mathematical identity, the strength of our economy too. But why? Two reasons: 1) As a whole, we haven’t de-levered since 2008. Just the opposite, and debt sits like on anvil on progress, and 2) ‘More money’ has created a destructive, self-perpetuating incentive system, whereby capital investment gives way to financial speculation. Trillions of dollars sitting idle delivering no return, encouraging investors to offset nothing with something, anything from other assets, driving their prices to the stratosphere. Trillions of dollars with no productive economic purpose, no incentive to be lent at paltry rates.
The last 4 quarterly releases of “Velocity of M2 Money Stock” …
Q3 2015: 1.500 Q4 2015: 1.487 Q1 2016: 1.463 Q2 2016: 1.448
If you want to know how we are doing, you need not look any deeper. The next release date is September 29th.
Recent monetary policy is directly responsible for this conundrum of inflated asset prices and anemic growth … again.
Christopher Wiegand, CFA


